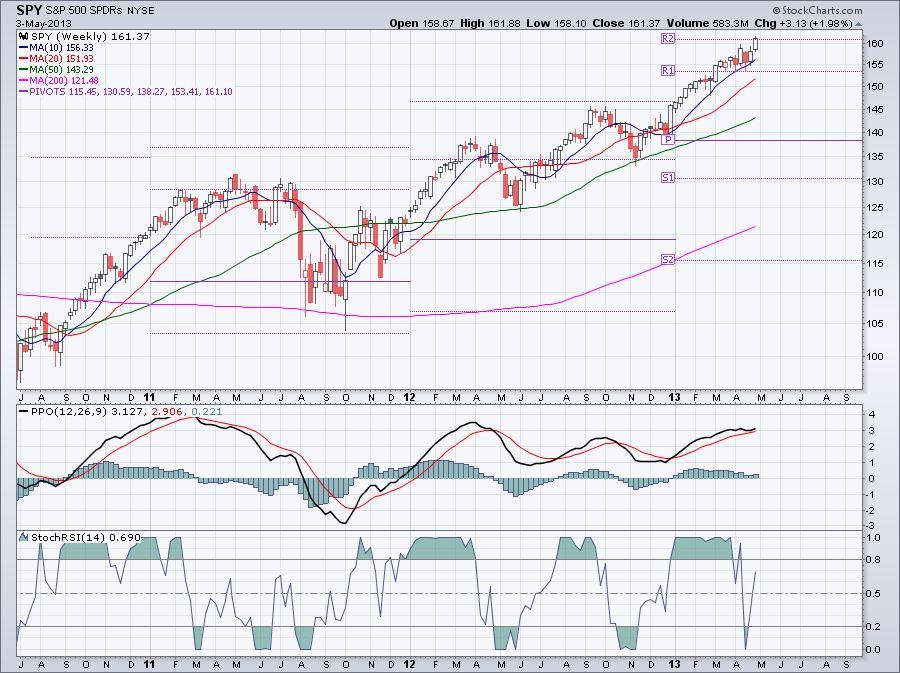
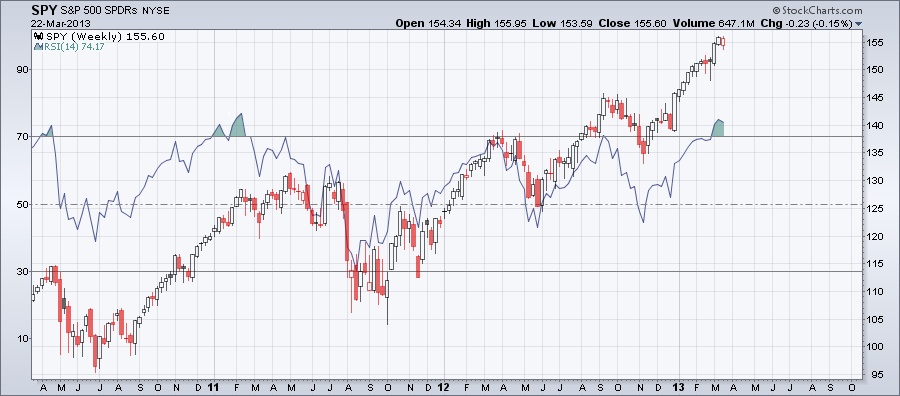
The weekly chart below shows SPY with PPO, which is similar to MACD and StochRSI oscillators. PPO is quite high and although SPY reached higher highs StochRSI didn't reach higher highs. Also notice that SPY already reached the yearly R2 pivot resistance. So what are the chances that it will move higher?
0 Comments
The Stochastic Oscillator is a momentum indicator which tracks the current location relative to the high-low range in a set number of periods. As a momentum indicator it changes direction before price. The Stochastic Oscillator is calculated as follows:
%K = (Current Close - Lowest Low)/(Highest High - Lowest Low) * 100 The StochRSI is the Stochastic calculation applied to RSI. This makes StochRSI an indicator of an indicator. The calculation is the following: StochRSI = (RSI - Lowest Low RSI) / (Highest High RSI - Lowest Low RSI) StochRSI moves between 0 and 1. This momentum indicator can be used to identify trends, trend reversals, oversold and overbought conditions. The chart below shows the weekly chart for SPY with StochRSI. As you can see StochRSI moved to 0 but the 5 period EMA of StochRSI is still above 0.5. When in previous instances SPY moved to 0 it signaled the beginning of a medium-term correction. Also notice heavier selling volume. Securities don't trend all the time. If they would, investing in securities would be the easiest thing to do. In an uptrend when prices move up it gains momentum, more and more buyers participate. Buyers become optimistic and demand exceeds supply driving prices even further up.
When this happens, prices move away from they longer term averages. This can be seen on a chart adding moving averages. The moving averages sort of fan out and they don't run parallel anymore. How long can it be sustained? At some point momentum start to fade. Some of the buyers are not willing to pay higher prices or don't buy at all being afraid that prices will reach their limit soon. At this point not only momentum indicators but other indicators show that the trend might be exhausted. This could happen in any time frame. This is the end of an uptrend followed by a consolidation or correction when prices revert back to their mean value. When this happens, the moving averages are getting closer again. The shorter moving averages even cross below the longer moving averages. In a healthy uptrend this mean reversion doesn't last long proportionally to the cycle. The moving average ribbon chart below shows how the moving averages "behave" in an uptrend and during a correction when mean reversion takes place. I mentioned in a previous post that there are basically for types of technical indicators. One of them is volatility indicators. One way to add volatility indicator to your chart is to use Bollinger Bands.
Bollinger Bands consist of a middle band and two outer bands. The middle band is a simple moving average, usually the 20-period SMA. The outer bands are usually set 2 standard deviation above and below the middle band. The bands narrow when volatility decreases and widen when volatility increases. The Bollinger Band Width indicator focuses only on the difference between the upper and lower band. A percentage value is calculated. The Bollinger Band Width helps us to identify periods when the volatility level is very low, prices are flat. This is called the squeeze. Periods of very low volatility are usually followed by periods of high volatility. After a squeeze prices can break above the upper band or below the lower band. Usually these breaks are strong. The chart below shows SPY with the Bollinger Bands and the Bollinger Band Width indicator. As you can see right now the bands are narrowing. Also prices are moving away from the upper band. I like to check out the weekly charts almost as frequently as the daily charts. Depending on the look back period some indicators can move faster. The very popular RSI indicator slowly moved into the overbought area. SPY can still move higher but there is a chance that a bigger correction is on the way. It was in early 2011 when RSI moved above 70 which ended up in a bigger decline later that year.
As we accumulate knowledge about the stock market and trading securities sometimes we make bold predictions. Our predictions are based on our technical analysis and all the information which is available today. And we try to extrapolate this knowledge to the future. What we ignore is that the future is uncertain. The farther we go out in time the bigger the chance that our predictions will fail since there is more and more uncertainty. We often predict that the current trend will hold for a long period of time or we prematurely predict that the current trend will reverse. We sometimes predict that supports or resistances will hold other times that they will break and enter a trade accordingly. We should keep in mind that prices fluctuate in waves in any timeframe. Prices can reverse any time. Just because the price movement reverses it doesn't mean that the stock market will crash. We always have to look at the longer trend. Instead of predicting we can anticipate price movements. Our anticipation is based on our analysis and statistics. At support and resistance levels we don't need to predict just to observe price movements and react accordingly. All we have to do is to follow the price. Before we enter a trade we can establish these support and resistance levels and plan our exit strategy ahead of time. |
Loading
Search Site
Links
Archives
September 2014
Categories
All
|